Quick answer
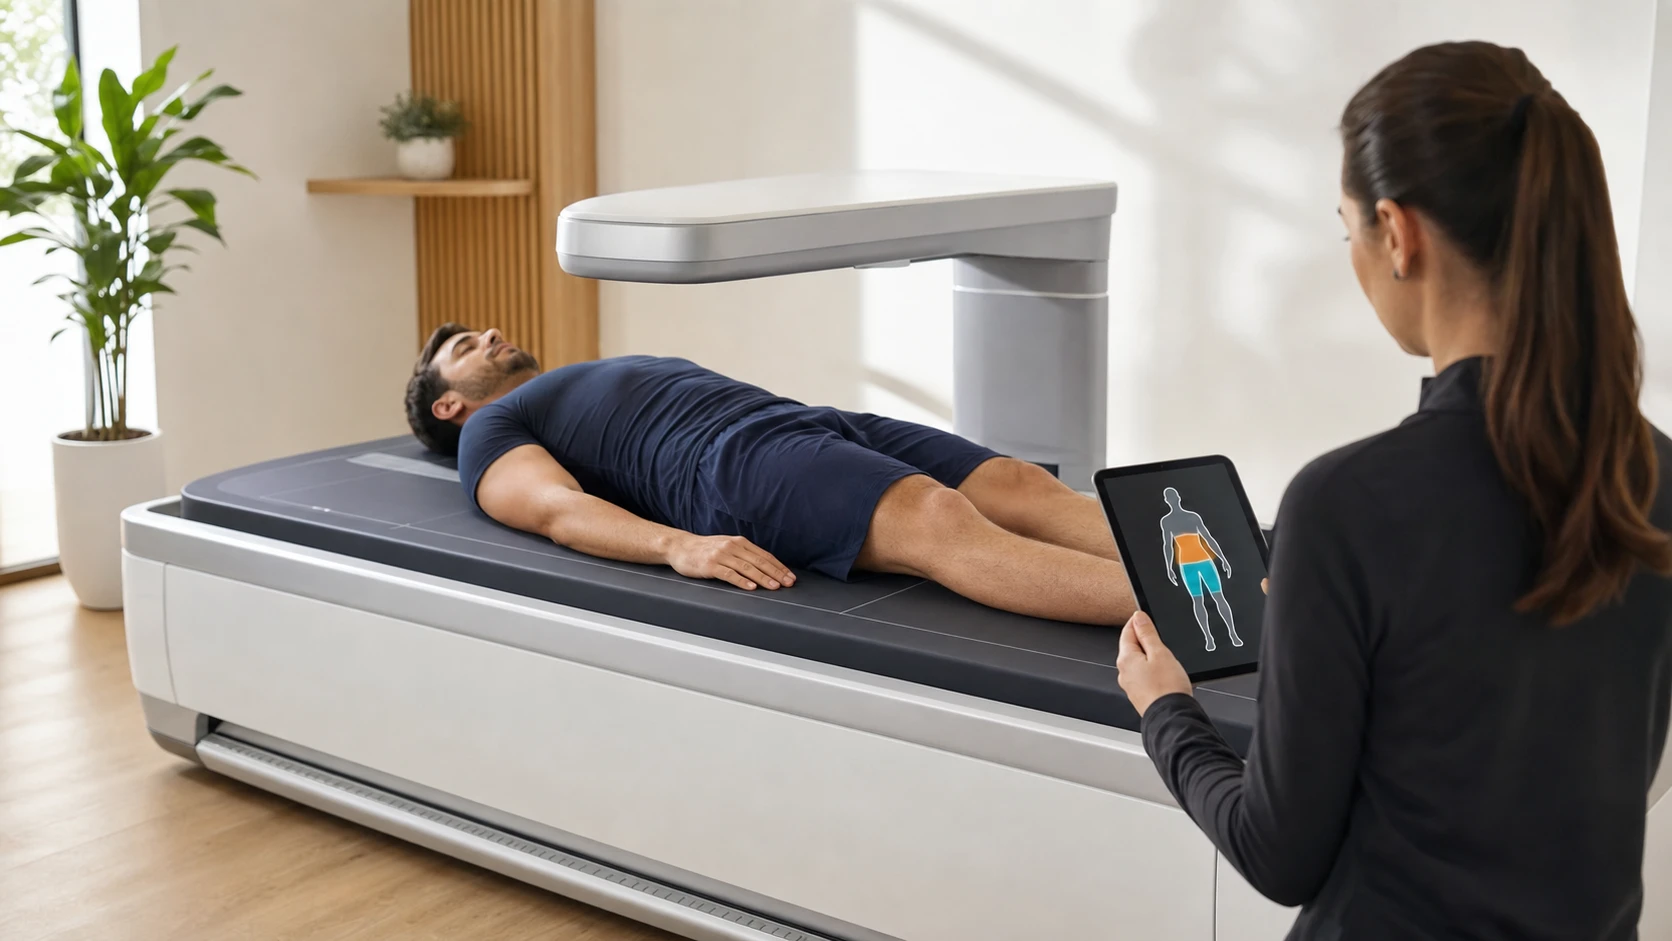
On a DEXA body composition report, the android region is the lower trunk around the abdomen. The gynoid region covers the hips and upper thighs. The android-to-gynoid ratio, often shortened to A/G ratio, compares how much fat is concentrated in those two regions.
A higher ratio means the scan found more android fat relative to gynoid fat. A lower ratio means more of the measured fat was concentrated around the hips and upper thighs relative to the abdomen. That makes the ratio a distribution metric, not another version of total body fat percentage.
There is no single A/G number that everyone should treat as a universal target. Age, sex, population, scanner software, and the exact ratio formula all affect interpretation. The most practical use is to read the component values, compare repeat scans produced by the same system, and view the result alongside total fat mass, waist measurements, and any separate visceral-fat estimate.
The practical interpretation
- Android: lower-trunk or abdominal region
- Gynoid: hip and upper-thigh region
- A/G ratio: android fat relative to gynoid fat
- Higher ratio: relatively more central fat distribution on that report
- Lower ratio: relatively more hip-and-thigh fat distribution on that report
- Best use: compare the same metric across well-matched scans, not against a universal internet cutoff
If you need the rest of the report first, start with how to read your DEXA scan results.
What does the android region include?
The name sounds like technology, but “android” is an anatomy term in this context. DEXA software places a defined region across the lower trunk near the abdomen and pelvis, then reports values such as fat mass, lean mass, total mass, or percent fat for that region.
The exact boundary is software-defined. In the CDC's 2017–2018 NHANES documentation, the android area was placed in the lower trunk above the pelvic line. The analysis software positioned the region lines automatically.
Android fat is not automatically the same as visceral fat. The android region contains abdominal tissue that can include both subcutaneous fat and deeper visceral fat. If the report provides a separate visceral adipose tissue estimate, treat that as a different metric rather than using the two labels interchangeably.
What does the gynoid region include?
The gynoid region covers the hips, gluteal area, and upper thighs. On the same NHANES system, the software placed this region below the android area using standardized boundaries tied to the height of the android region.
This regional measurement helps answer a question that total body fat cannot: where is the measured fat distributed? Two people can have the same total fat mass and body fat percentage while having different android and gynoid patterns.
That distinction also matters within one person's progress. Total fat mass might decline while the regional pattern changes at a different pace.
How is the A/G ratio calculated?
First check what your specific report means by A/G ratio. The formula is not presented identically in every report or research paper. Some research calculates android fat mass divided by gynoid fat mass. Some DEXA reporting contexts compare android percent fat with gynoid percent fat.
Those calculations are related, but they are not interchangeable. Do not compare a fat-mass ratio from one source with a percent-fat ratio from another as if they were the same measurement.
For an illustrative report that defines A/G as android percent fat divided by gynoid percent fat:
- 36% android fat divided by 45% gynoid fat equals an A/G ratio of 0.80.
- 45% android fat divided by 36% gynoid fat equals an A/G ratio of 1.25.
The second example reflects more android fat relative to gynoid fat. It does not, by itself, diagnose a condition or explain why the distribution exists.
A/G ratio is not the same as visceral fat
The two measurements can be related, but they answer different questions.
- A/G ratio compares two broad body regions.
- Visceral fat refers to fat stored deeper within the abdomen around internal organs.
- Waist circumference is a tape measurement around the trunk.
- Waist-to-hip ratio compares two external circumferences, not DEXA regions.
A DEXA report may show android fat, gynoid fat, A/G ratio, and a separate visceral-fat estimate at the same time. Reading all four labels as one number can make the report more confusing than useful.
For a closer look at the deeper abdominal measurement, read DEXA scanning for visceral fat.
What is a good android-to-gynoid ratio?
There is not one responsible cutoff for every person and every system.
A 2024 study using large Chinese and U.S. data sets found that android-to-gynoid fat patterns varied by age, sex, and race or ethnicity. The study also calculated the ratio from regional fat mass, which is a reminder to confirm the formula before borrowing a reference value.
Population studies have found associations between more central fat distribution and cardiometabolic risk factors. For example, a cross-sectional analysis of normal-weight U.S. adults found stronger correlations between the A/G percent-fat ratio and several measured risk factors than between BMI and those same factors. But an association in a population study does not turn one scan result into a diagnosis or an individual risk score.
A better interpretation sequence is:
1. Confirm whether the report uses fat mass or percent fat. 2. Review the android and gynoid values that created the ratio. 3. Use reference information supplied for that scanner and report when available. 4. Compare with your own prior scan taken under similar conditions. 5. Bring medical-risk questions to an appropriate qualified healthcare professional.
How to compare the ratio between scans
Use the A/G ratio as one line in a trend, not the whole scorecard.
Keep the measurement system consistent
Scanner manufacturer, software, analysis regions, and report calculations can differ. Comparing two scans from the same device and software is more useful than comparing numbers from unrelated reports.
Match your preparation
Hydration, recent food, training, glycogen, positioning, and clothing can affect body composition estimates. Follow the same preparation routine when practical. The guide to DEXA scan accuracy explains why consistency matters.
Inspect the numerator and denominator
A ratio can change for more than one reason. It may fall because android fat decreased, because gynoid fat increased, or because both regions changed at different rates. Always read the regional fat values beside the ratio.
Pair it with direct progress measures
Review total fat mass, body fat percentage, waist measurement, training performance, and any separate visceral-fat estimate. During fat loss, the strongest story is usually a group of measurements moving coherently—not one ratio moving alone.
Allow enough time for change
Short-interval scans can amplify normal noise. Schedule the follow-up around a meaningful training, nutrition, or weight-change period and the decision you want the scan to support.
Quick FAQ
Does android fat mean visceral fat?
No. The android region is a broader lower-trunk area. It can include both subcutaneous and visceral abdominal fat. A separate visceral-fat estimate, when available, is its own report metric.
Is gynoid fat the same as leg fat?
No. The gynoid region focuses on the hips and upper thighs. A report's full leg region extends farther and is analyzed separately.
Is an A/G ratio above 1 always bad?
Do not use 1 as a universal medical cutoff. A value above 1 means the android value is greater than the gynoid value under that report's formula. Interpretation still depends on the measurement definition, reference population, scanner, and individual context.
Can the ratio improve even if my weight stays the same?
Yes. Regional fat values can change while scale weight is stable. Check whether total fat mass, lean mass, waist measurement, and the android and gynoid components support the same trend.
Is A/G ratio the same as waist-to-hip ratio?
No. Waist-to-hip ratio uses tape-measure circumferences. A/G ratio comes from software-defined DEXA regions and regional fat estimates.
Can this number diagnose a health problem?
No. A body composition scan does not diagnose diabetes, cardiovascular disease, metabolic syndrome, or another medical condition. Use health concerns and laboratory results with an appropriate clinician.
Build a regional body composition baseline in Irvine
If you want to track more than scale weight, a DEXA baseline can show total fat mass, lean mass, and regional distribution in one report. The A/G ratio becomes more useful when the follow-up uses the same scanner, software, and preparation routine.
Read the local guide to DEXA scans in Irvine and Orange County, then join the Founding Member List before booking opens to lock in $49 standard CLUB DEXA body composition scans for life, subject to additional terms. Expected regular pricing after launch starts at $89 per standard scan. No payment is due today, and email confirmation is required to lock the offer.
Sources and fine print
- CDC/NCHS: NHANES android and gynoid DXA documentation
- Journal of Global Health: Body fat variation and redistribution across different stages of life
- Nutrition & Diabetes: Android and gynoid fat patterns in normal-weight U.S. adults
CLUB DEXA provides body composition scans for fitness and wellness tracking. It does not diagnose medical conditions, calculate an individualized disease risk, or provide medical advice. Regional fat definitions, formulas, reference values, and available metrics depend on the scanner and software. Discuss cardiometabolic risk, symptoms, medications, pregnancy, or health concerns with an appropriate qualified healthcare professional.
Related articles

Should You Drink Water Before a DEXA Scan?
Learn how water intake can affect a DEXA body-composition result and how to keep repeat scans more comparable.
DEXA Scan vs Waist Measurement: What Each Can Tell You
Compare a DEXA body-composition scan with a waist measurement, including what each tracks, why the numbers are not interchangeable, and how to use both in a repeatable progress routine.
DEXA Scan vs Skinfold Calipers: Which Is Better for Body Fat Tracking?
Compare DEXA scans and skinfold calipers for body-fat tracking, including what each method measures, why the results differ, and how to choose a repeatable baseline.



Join as a Founding Member
Lock in $49 DEXA scans for life. Join the Founding Member List before booking opens in Irvine. Your standard body composition scan price will never increase, subject to additional terms. Expected regular pricing after launch starts at $89 per scan.
- $49 scans for life
- Priority launch booking
- No cost to join
No payment today. No spam. Your Founding Member price will never increase. Founding pricing applies to standard CLUB DEXA body composition scans for the registered email/account holder. Founding Member pricing includes up to 6 standard scans per calendar year. Additional scans are subject to regular pricing. Non-transferable. Excludes add-ons, bundles, third-party services, and special clinical services. Subject to appointment availability. Expected regular pricing may change before or after launch. Email verification is required before Founding Member pricing is treated as locked.